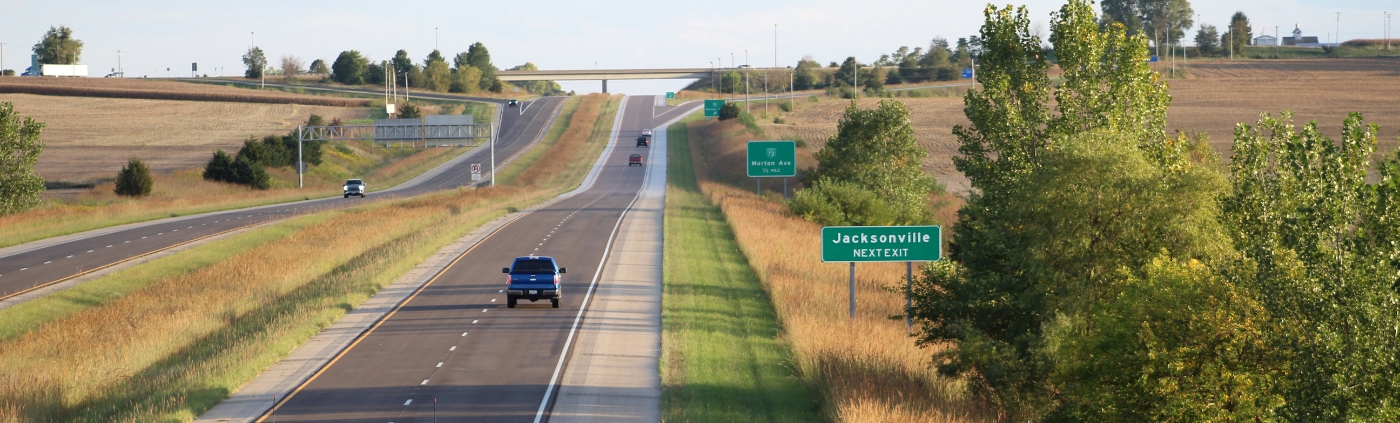

Fast access to St. Louis, Indianapolis, Chicago, Kansas City and Des Moines.
| Population | 2000 | 2010 | 2025 | 2030 |
|---|---|---|---|---|
| Morgan County | 36,620 | 35,551 | 31,551 | 30,622 |
Source: ESRI, 2025-08-25
| Population | 2025 |
|---|---|
| 0-4 | 1,528 |
| 5-9 | 1,665 |
| 10-14 | 1,697 |
| 15-19 | 2,158 |
| 20-24 | 1,768 |
| 25-29 | 1,825 |
| 30-34 | 1,911 |
| 35-39 | 1,976 |
| 40-44 | 1,978 |
| 45-49 | 1,741 |
| 50-54 | 1,796 |
| 55-59 | 1,900 |
| 60-64 | 2,239 |
| 65-69 | 2,204 |
| 70-74 | 1,875 |
| 75-79 | 1,439 |
| 80-84 | 958 |
| 85+ | 893 |
| 18+ | 25,662 |
| Median Age | 43 |
Source: ESRI, 2025-08-25
| Morgan County | 2025 |
|---|---|
| Total | 31,551.00 |
| White Alone | 86.38% |
| Black Alone | 6.35% |
| American Indian Alone | 0.25% |
| Asian Alone | 0.85% |
| Pacific Islander Alone | 0.05% |
| Some Other Race | 1.3% |
| Two or More Races | 4.82% |
| Hispanic Origin | 3.04% |
| Diversity Index | 29.20 |
Source: ESRI, 2025-08-25
| Morgan County | 2025 - 2030 |
|---|---|
| Population | -0.60% |
| Households | -0.26% |
| Families | -0.42% |
| Median Household Income | 2% |
| Per Capita Income | 2% |
Source: ESRI, 2025-08-25
| Population | 2000 | 2010 | 2025 | 2030 |
|---|---|---|---|---|
| Households | 14,040 | 14,105 | 13,314 | 13,141 |
| Housing Units | 15,292 | 15,516 | 14,971 | 14,796 |
| Owner Occupied Units | 9,545 | 9,582 | ||
| Renter Occupied Units | 3,769 | 3,559 | ||
| Vacant Units | 1,657 | 1,655 |
Source: ESRI, 2025-08-25
| Morgan County | 2025 | 2030 |
|---|---|---|
| Median Home Value | $147,179 | $155,942 |
| Average Home Value | $175,518 | $185,198 |
| <$50,000 | 682 | 617 |
| $50,000 - $99,999 | 2,001 | 1,858 |
| $100,000 - $149,999 | 2,180 | 2,036 |
| $150,000 - $199,999 | 2,052 | 2,036 |
| $200,000 - $249,999 | 785 | 850 |
| $250,000 - $299,999 | 658 | 786 |
| $300,000 - $399,999 | 827 | 986 |
| $400,000 - $499,999 | 205 | 245 |
| $500,000 - $749,999 | 90 | 103 |
| $1,000,000 + | 33 | 36 |
Source: ESRI, 2025-08-25
| Year Range | Houses Built |
|---|---|
| 2010 or Later | 484 |
| 2000-2009 | 1,006 |
| 1990-1999 | 1,682 |
| 1980-1989 | 851 |
| 1970-1979 | 2,549 |
| 1960-1969 | 2,055 |
| 1950-1959 | 1,702 |
| 1940-1949 | 865 |
| 1939 or Before | 3,787 |
Source: ESRI, 2025-08-25
Back To Top| Morgan County | 2025 | 2030 |
|---|---|---|
| Median Household | $67,215 | $74,538 |
| Average Household | $86,297 | $92,946 |
| Per Capita | $36,716 | $40,196 |
Source: ESRI, 2025-08-25
| Morgan County | 2025 |
|---|---|
| <$15,000 | 1,165 |
| $15,000 - $24,999 | 993 |
| $25,000 - $34,999 | 1,082 |
| $35,000 - $49,999 | 1,865 |
| $50,000 - $74,999 | 2,166 |
| $75,000 - $99,999 | 1,972 |
| $100,000 - $149,999 | 2,529 |
| $150,000 - $199,999 | 712 |
| $200,000+ | 830 |
Source: ESRI, 2025-08-25
Back To Top| Category | Commuters |
|---|---|
| Workers 16+ | 14,254 |
| In-County Residents | 10,994 |
| Out-of-County Residents | 3,147 |
| Drive Alone | 11,722 |
| Carpooled | 835 |
| Public Transport | 161 |
| Work at Home | 1,258 |
| Motorcycle | 26 |
| Bicycle | 11 |
| Walked | 215 |
| Other | 26 |
| Less than 5 minutes | 1,166 |
| 5-9 minutes | 3,028 |
| 10-14 minutes | 2,528 |
| 15-19 minutes | 1,754 |
| 20-24 minutes | 1,054 |
| 25-29 minutes | 409 |
| 30-34 minutes | 905 |
| 35-39 minutes | 320 |
| 40-44 minutes | 468 |
| 45-59 minutes | 932 |
| 60-89 minutes | 258 |
| 90+ minutes | 174 |
| Average Travel Time | 19 |
Source: ESRI, 2025-08-25
Source: ESRI, 2025-08-25
| Category | Number |
|---|---|
| Total Employees | 15,053 |
| Agr/Forestry/Fish/Hunt | 65 |
| Mining | 0 |
| Utilities | 12 |
| Construction | 633 |
| Manufacturing | 1,514 |
| Wholesale Trade | 565 |
| Retail Trade | 1,836 |
| Motor Veh/Parts Dealers | 196 |
| Furn & Home Furnish Str | 21 |
| Electronics & Appl Store | 28 |
| Bldg Matl/Garden Equip | 202 |
| Food & Beverage Stores | 302 |
| Health/Pers Care Stores | 139 |
| Gasoline Stations | 126 |
| Clothing/Accessory Store | 57 |
| Sports/Hobby/Book/Music | 132 |
| General Merchandise Str | 633 |
| Transportation/Warehouse | 295 |
| Information | 761 |
| Finance & Insurance | 367 |
| Cntrl Bank/Crdt Intrmdtn | 254 |
| Sec/Cmdty Cntrct/Oth Inv | 24 |
| Insur/Funds/Trusts/Other | 89 |
| Real Estate/Rent/Leasing | 132 |
| Prof/Scientific/Tech Srv | 620 |
| Legal Services | 66 |
| Mgmt of Comp/Enterprises | 9 |
| Admin/Support/Waste Mgmt | 231 |
| Educational Services | 1,873 |
| HealthCare/Social Assist | 2,674 |
| Arts/Entertainment/Rec | 284 |
| Accommodation/Food Srvcs | 1,182 |
| Accommodation | 109 |
| Food Srv/Drinking Places | 1,073 |
| Other Srv excl Pub Admin | 807 |
| Auto Repair/Maintenance | 140 |
| Public Administration Emp | 1,148 |
Source: ESRI, 2025-08-25
| Morgan County | 2025 |
|---|---|
| <9th Grade | 481 |
| Some High School | 1,634 |
| GED | 1,454 |
| Graduated High School | 7,871 |
| Some College/No Degree | 3,996 |
| Associates Degree | 1,699 |
| Bachelor's Degree | 3,894 |
| Graduate Degree | 1,706 |
Source: ESRI, 2025-08-25
Back To Top| Category | Number |
|---|---|
| Total Businesses | 1,188 |
| Agr/Forestry/Fish/Hunt Bus | 18 |
| Mining Bus | 0 |
| Utilities Bus | 2 |
| Construction Bus | 72 |
| Manufacturing Bus | 32 |
| Wholesale Trade Bus | 33 |
| Retail Trade Bus | 161 |
| Motor Veh/Parts Dealers Bus | 19 |
| Furn & Home Furnish Str Bus | 6 |
| Electronics & Appl Store Bus | 5 |
| Bldg Matl/Garden Equip Bus | 14 |
| Food & Beverage Stores Bus | 22 |
| Health/Pers Care Stores Bus | 18 |
| Gasoline Stations Bus | 17 |
| Clothing/Accessory Store Bus | 13 |
| Sports/Hobby/Book/Music Bus | 24 |
| General Merchandise Str Bus | 23 |
| Transportation/Warehouse Bus | 37 |
| Information Bus | 29 |
| Finance & Insurance Bus | 62 |
| Cntrl Bank/Crdt Intrmdtn Bus | 29 |
| Sec/Cmdty Cntrct/Oth Inv Bus | 9 |
| Insur/Funds/Trusts/Other Bus | 24 |
| Real Estate/Rent/Leasing Bus | 36 |
| Prof/Scientific/Tech Srv Bus | 56 |
| Legal Services Bus | 8 |
| Mgmt of Comp/Enterprises Bus | 2 |
| Admin/Support/Waste Mgmt Bus | 35 |
| Educational Services Bus | 53 |
| HealthCare/Social Assist Bus | 114 |
| Arts/Entertainment/Rec Bus | 28 |
| Accommodation/Food Srvcs Bus | 85 |
| Accommodation Bus | 13 |
| Food Srv/Drinking Places Bus | 72 |
| Other Srv excl Pub Admin Bus | 187 |
| Auto Repair/Maintenance Bus | 28 |
| Public Administration Bus | 84 |
Source: ESRI, 2025-08-25
Back To Top

Community Guide is Available
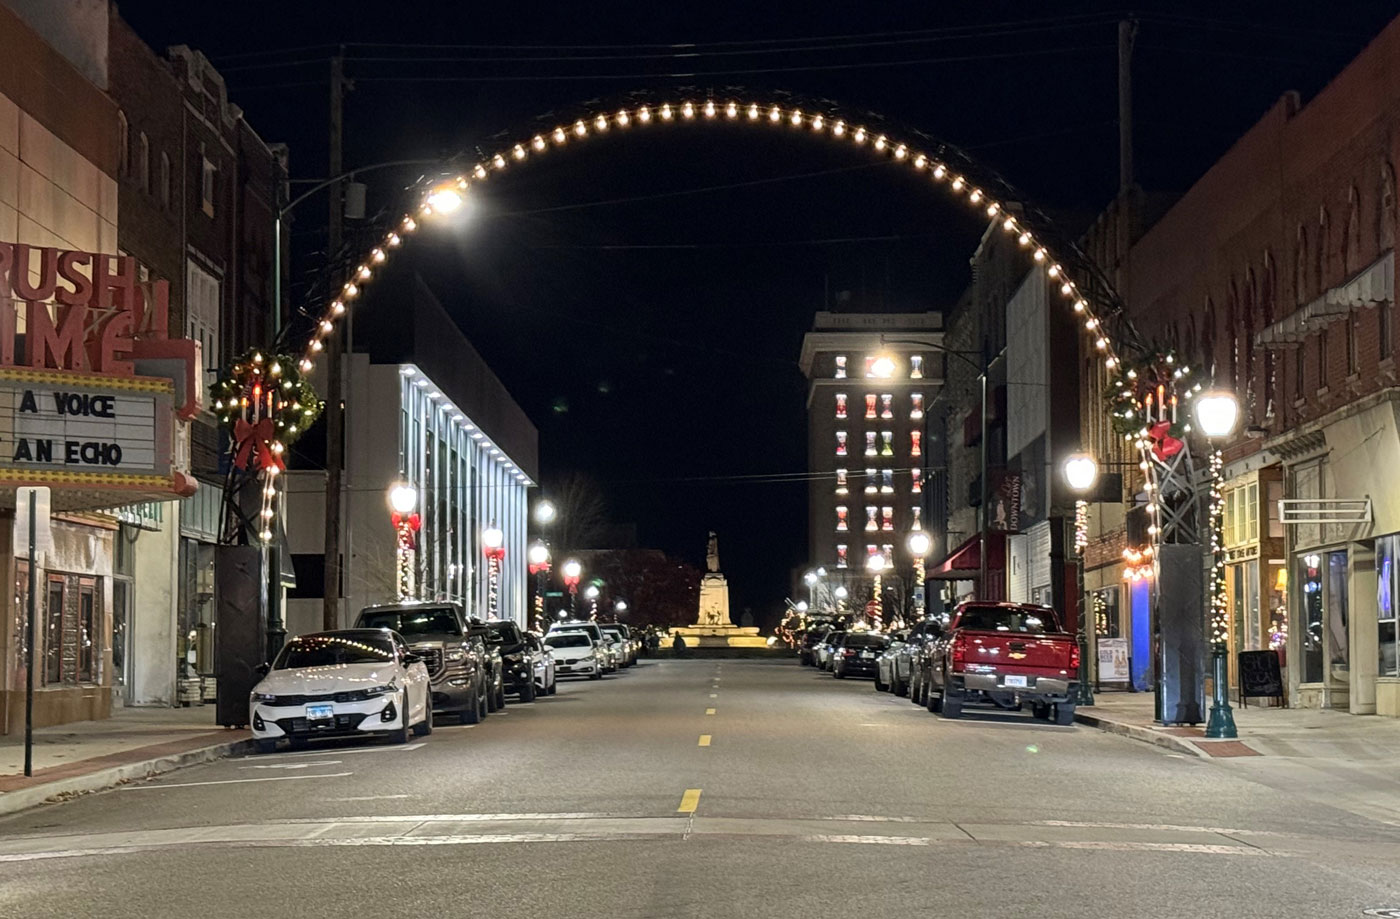
The City of Jacksonville is located in west central Illinois, 35 miles west of Springfield, the state capital. It is the county seat of Morgan County and one of the oldest towns in the Land of Lincoln, founded in 1825. Jacksonville was established by Yankee settlers from New England, who laid out farms, constructed roads, erected government buildings, and established post routes. They were part of a wave of European/American farmers who headed west into what was then the wilds of the Northwest Territory, during the early 1800s. Download Here!